
All hail the FTSE 100?
The market volatility and sell-off in risk assets that have followed the UK’s unexpected vote to leave the EU in last week’s referendum have generated significant headline interest. As markets have stabilised, those in favour of leaving have trumpeted the rally in the FTSE 100 index over the closing days of June as a sign all will be well for the UK. As the second column in the table below highlights, the index of the largest 100 companies listed in the UK is now above the closing level from 23 June (the day before the outcome of the vote was announced). The table also shows this is very different from all the major European and global equity indices – some suggest this indicates that it is the sclerotic eurozone that is more vulnerable to Brexit-related uncertainty.

Source: Newton
Reality check
Given the global businesses (and a skew to the resources sector) within the FTSE 100, it is hard to read the resilience of this index as an indication of market confidence in the UK economy. Broadly, it appears that the market has been very efficient in marking up companies with revenues generated outside the UK that are likely to benefit from the fall in the value of the pound. The performance of the more domestic FTSE 250 and small cap indices – shown at the bottom of column 2 – seem more reflective of the anticipated near-term headwinds from the decision to leave the EU.
The other factor ignored in the simplistic attention paid to the resilience of the FTSE 100 is that of currency. The FTSE 100 is quoted in sterling, whereas the major comparators across Europe are of course priced in euros. Adjusting for this difference and looking at all markets in terms of US dollars shows a less remarkable performance divergence. In this more global context, the FTSE 100 has certainly not maintained its purchasing power from the eve of the referendum.
Hold your horses
Does this widespread derating of risk assets imply significant opportunity to add to equity positions in the post-referendum political vacuum? Unfortunately, the challenge for long-term investors remains that, after years of central bank manipulation, valuations of risk assets remain high. The chart below shows the P/E (price to earnings) multiple on the MSCI World Index, using the Bloomberg estimate of prospective earnings. As of the close of 30 June, this is 16.3x, hardly inexpensive in the context of recent history.
MSCI World Index P/E ratio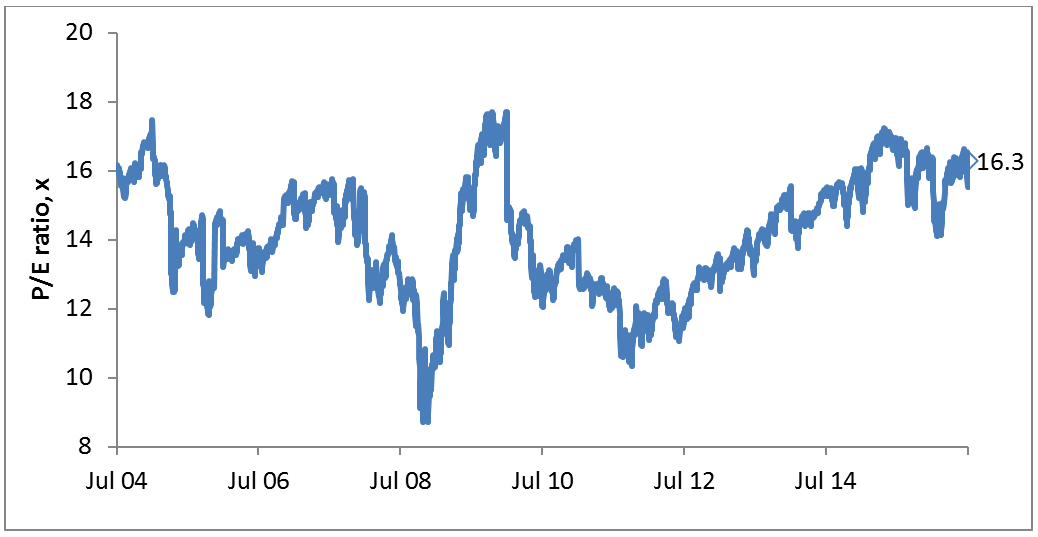 Source: Newton
With the complexities of the post-vote backdrop adding to the already challenging outlook for corporate earnings, it seems unlikely that the prospect of another (possible) slug of central bank liquidity will be sufficient to further levitate risk asset valuations. This is likely to be particularly pertinent, as market participants are increasingly cognisant of the unintended costs of authorities’ promise to do ‘whatever it takes’ to prevent asset prices from adjusting to reality.
While the adverse consequences of a ‘no-yield’ world have gradually been dawning on financial-market participants, the ramifications of widening social divisions (which are exacerbated further by asset-price inflating policies) give further cause to see high valuation as a headwind to equity returns.
In our view, patience in awaiting a more attractive entry point is likely to be appropriate.
Authors

Newton Real Return team
The team who manage the Newton Real Return strategy.


Comments