

In his article “What the Fed did and why” in late 2010, then chairman Ben Bernanke set out the justification for the launch of ‘QE2’ (the second wave of bond purchases by the US central bank) at the time, and explained that it was an attempt to repeat the policy success of 2009 and ease financial conditions.[1]
A key element of the Fed’s approach, according to Dr Bernanke, was the expectation that the resulting “higher stock prices will boost consumer wealth and help increase confidence, which can also spur spending. Increased spending will lead to higher incomes and profits that, in a virtuous circle, will further support economic expansion”.
As the chart here demonstrates, unconventional monetary policies have indeed raised household net worth. However, the boost to activity – especially when measured in nominal terms to include price change – has continued to disappoint the optimistic expectations of central banks.
US household net worth
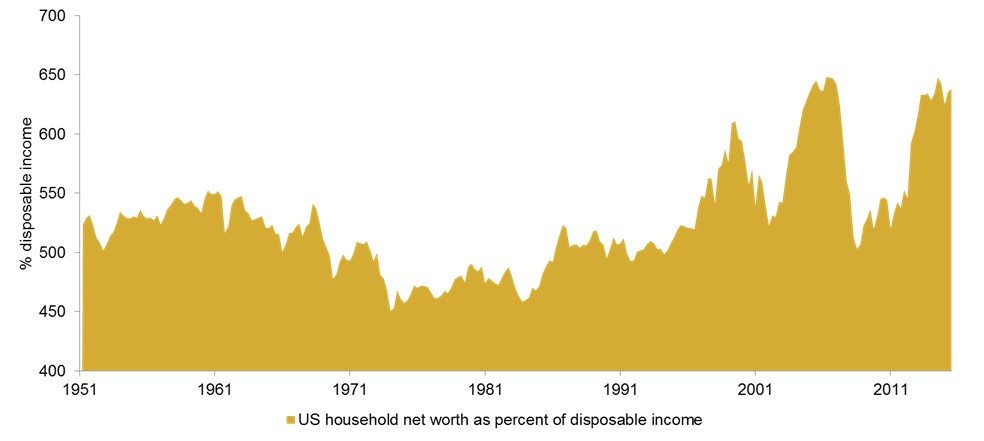 Source: Bloomberg data, September 2016
More troubling is what is revealed when examining the ‘stock’ of household balance sheets in comparison to their own history, rather than relying on the typical central-bank focus on measures of ‘flow’ in GDP or spending data.
In the last 60 years, household net worth has only exceeded 600% of disposable income on two previous occasions: Q4 1999-Q1 2000 and the end of 2004 to the end of 2007.[2] In retrospect, history judged these periods to be wildly distorted, unstable and inevitably vulnerable to unanticipated shocks.
In the second quarter of 2016, the ratio of household net worth to disposable income reached 638%.
It remains to be seen whether faith in central-bank intervention can continue to maintain this elevated level of asset valuation, or whether, as Alan Greenspan, Mr Bernanke’s predecessor, observed in 2005, this has this once again left investors vulnerable: “…what they perceive as newly abundant liquidity can readily disappear. Any onset of increased investor caution elevates risk premiums and, as a consequence, lowers asset values and promotes the liquidation of the debt that supported higher asset prices. This is the reason that history has not dealt kindly with the aftermath of protracted periods of low risk premiums.”[3]
[1] http://www.washingtonpost.com/wp-dyn/content/article/2010/11/03/AR2010110307372.html
[2] Source: Bloomberg data, September 2016
[3] http://www.federalreserve.gov/boarddocs/speeches/2005/20050826/default.htm
Authors

Newton Real Return team
The team who manage the Newton Real Return strategy.
Any reference to a specific security, country or sector should not be construed as a recommendation to buy or sell this security, country or sector. Please note that holdings and positioning are subject to change without notice.


Comments