Key Points
- Interest-Rate Impact: Small and SMID-cap companies, carrying twice as much debt as their larger counterparts, are more sensitive to short-term interest rates. With the Federal Reserve (Fed) maintaining a higher-for-longer stance, the potential cost impact could weigh heavily on the balance sheets and profitability of smaller companies.
- Earnings Pressure: Earnings pressure tends to weigh more on small and SMID-cap equities than on their larger counterparts, especially in a high-interest-rate environment. However, if the Fed eases rates as forecasted, it could pave the way for a more growth-conducive monetary policy framework, potentially improving sentiment toward smaller-cap stocks in the coming months.
- 2024/2025 Outlook: Despite a decade of underperformance relative to large caps, we believe the current scenario presents distinct advantages for small and SMID-cap investors, including attractive relative valuations and the potential for a trough in relative earnings growth expectations. With valuations at historic lows compared to large caps, potential interest-rate cuts on the horizon, and accelerating merger-and-acquisition (M&A) and initial-public-offering (IPO) activity, smaller caps may offer significant alpha opportunities for investors.
Over the last ten-plus years, large caps have fueled the US stock market, owing in part to a surge in the technology industry. More recently, over the last three years, smaller companies have faced persistent headwinds with rising inflation and tightening monetary policy, trailing even further behind their larger peers.
Listen on
In late 2023, policymakers signaled that the outlook for 2024/2025 could be brighter, with a potential end to the current cycle of rate hikes in sight. While inflation remained sticky in the first quarter of 2024, prompting the Fed to hold rates steady, investor sentiment was buoyed as the central bank continued to signal three rate cuts this year. With potential interest-rate cuts on the horizon, and with valuations at historic lows relative to their large-cap brethren, could small and SMID-cap equities—or those captured within Russell 2500™ Index— be ripe for a comeback?
With potential interest-rate cuts on the horizon, and with valuations at historic lows relative to their large-cap brethren, could small and SMID-cap equities—or those captured within Russell 2500™ Index— be ripe for a comeback?
Interest Rates: Higher for How Long?
Smaller businesses often rely more heavily on outside financing than their larger-cap counterparts. Russell 2000®companies have an average net-debt-to-EBITDA (earnings before interest, taxes, depreciation and amortization) ratio of 3.3, compared with 1.6 for S&P 500® constituents.1 Simply put, small-cap companies carry twice as much debt as large-cap companies relative to their overall profits, and thus debt servicing is a considerable factor in their profitability. Additionally, only 55% of Russell 2000® companies carry fixed-rate debt, compared with over 90% of S&P 500® companies,2 rendering smaller companies more sensitive to short-term interest rates than larger companies because of the need to refinance at higher rates. If the Fed maintains its higher-for-longer stance for an extended period of time, the cost impact to smaller companies could be substantial, dragging on balance sheets and businesses as floating-rate debts are refinanced at higher rates.
Pressure for Earnings
Earnings pressure tends to weigh more on small and SMID-cap equities than on their large-cap peers. It may be challenging for small caps to find their footing if the high-interest-rate environment continues through 2024. However, if the Fed does begin to ease rates this year, as policymakers forecast, we could see the onset of a monetary-policy framework more conducive to growth. In our view, should markets remain true to their forward-looking nature, sentiment toward small-cap stocks could improve meaningfully in the coming months ahead of a Fed policy pivot.
2024/2025 Small and SMID-Cap Outlook
We believe that the small-SMID asset class currently offers distinct advantages to investors versus large caps, including attractive relative valuations as well as a potential trough in relative earnings-growth expectations.
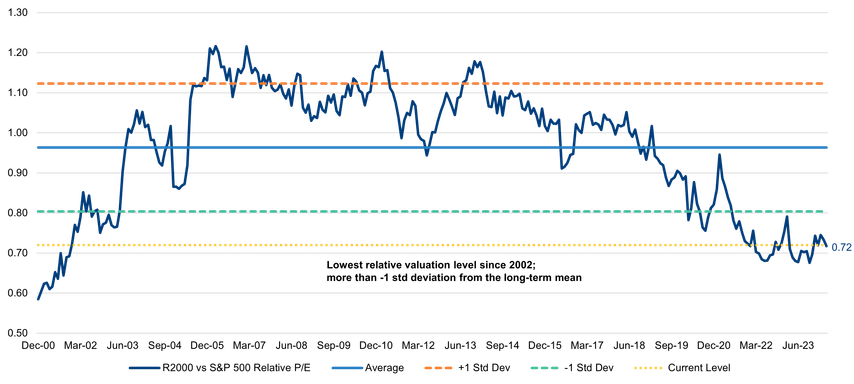
Over the past decade, small and SMID-cap stocks have seen their valuations fall dramatically relative to large caps, especially in the post-pandemic period. As Covid restrictions eased and the global economy reopened, supply-demand dynamics became further distorted, exacerbated by unprecedented fiscal stimulus. Accordingly, large-cap valuations significantly outpaced those of smaller caps, which lacked large caps’ scale.
Large-cap equities—particularly the group of mega-cap technology growth stocks dubbed the Magnificent Seven—have largely driven market performance since the downturn in 2022. Despite a brief rally in the fourth quarter of 2023, smaller caps remain in an extended cycle of underperformance, both on an absolute basis and relative to large caps.
When the Fed does eventually cut interest rates, we believe smaller-cap stocks are poised to benefit. As depicted in the chart below, valuations of small caps relative to large caps have fallen back to 2002 levels. In our view, this could provide an attractive entry point for investors.
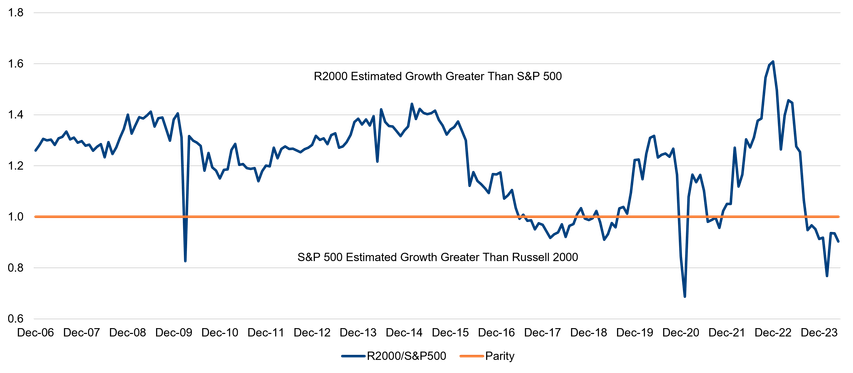
Additionally, M&A and IPO activity appears to be accelerating down the capitalization scale, which we believe could unlock robust alpha opportunities. While the earnings-growth estimate for 2024 has been reduced, earnings and sales revision ratios are holding up well for small caps. As the year progresses, we believe growth rates should pick up and get closer to that of large caps. If this shift occurs, we could see sustainable opportunities in small caps.
Russell 2000 Index Versus S&P 500 Index Relative Price-to-Earnings (P/E) Fiscal Year (FY) 2 Estimates

In 2024, earnings growth is expected to slow broadly across the economy. Last year, the deceleration in earnings-growth estimates was faster among smaller-cap stocks, as companies likely factored in the impact of soaring rates on their bottom lines. In our view, the projected effects of high interest rates in these reports may be overblown, given the Fed’s decision to hold rates steady, albeit with little indication as to the timing of eventual rate cuts.
After peaking in late October 2023 at almost 5%, the 10-year Treasury yield fell to 3.8% in late December, rising again to almost 4.7% in early 2024 before settling in at around 4.5% in May. The direction of interest rates is anyone’s guess, as economic and employment signals have been mixed, with signs of both strength and weakness. Inflation seems to be the Fed’s primary focus, and while inflation is down, officials are not convinced that we are out of the woods yet; many interpret this as a sign of higher-for-longer rates. With that said, higher rates should eventually bite, slowing the economy and weighing on employment, which should drop inflation to a level that would allow the Fed to slowly cut rates.
Russell 2000 Index Versus S&P 500 Index Earnings Per Share Growth Estimates Over Three-to-Five Years

Global economic growth is also expected to slow in 2024. As the revenues of smaller-cap US companies have less exposure to international markets, they may be less susceptible to the effects of a global economic slowdown as well as current geopolitical volatility. However, higher commodity prices and labor costs can weigh on companies across the entire capitalization spectrum.
A Case for Smaller Caps
We believe that the multi-year low in valuations, coupled with potentially higher earnings growth, could create a compelling case for smaller caps as we head into the latter half of 2024 and into 2025.
In our view, there is a reversion to the mean at play here as well. On average, small-caps stocks make up almost 7% of the US equity market. However, in recent years, that percentage has fallen dramatically to just under 4%, levels not seen since the 1930s. This could be viewed as further evidence that small caps, long ignored by investors, are gearing up for a potential rebound.
1 Source: FactSet as of April 30, 2024.
2 Source: FactSet as of April 30, 2024.
PAST PERFORMANCE IS NOT NECESSARILY INDICATIVE OF FUTURE RESULTS. Any reference to a specific security, country or sector should not be construed as a recommendation to buy or sell this security, country or sector. Please note that strategy holdings and positioning are subject to change without notice. MAR006290 Exp 06/29. For additional Important Information, click on the link below.
Important information
US - Text disclosure - NIMNA
For Institutional Clients Only. Issued by Newton Investment Management North America LLC ("NIMNA" or the "Firm"). NIMNA is a registered investment adviser with the US Securities and Exchange Commission ("SEC") and subsidiary of The Bank of New York Mellon Corporation ("BNY Mellon"). The Firm was established in 2021, comprised of equity and multi-asset teams from an affiliate, Mellon Investments Corporation. The Firm is part of the group of affiliated companies that individually or collectively provide investment advisory services under the brand "Newton" or "Newton Investment Management". Newton currently includes NIMNA and Newton Investment Management Ltd ("NIM") and Newton Investment Management Japan Limited ("NIMJ").
Material in this publication is for general information only. The opinions expressed in this document are those of Newton and should not be construed as investment advice or recommendations for any purchase or sale of any specific security or commodity. Certain information contained herein is based on outside sources believed to be reliable, but its accuracy is not guaranteed.
Statements are current as of the date of the material only. Any forward-looking statements speak only as of the date they are made, and are subject to numerous assumptions, risks, and uncertainties, which change over time. Actual results could differ materially from those anticipated in forward-looking statements. No investment strategy or risk management technique can guarantee returns or eliminate risk in any market environment and past performance is no indication of future performance.
Information about the indices shown here is provided to allow for comparison of the performance of the strategy to that of certain well-known and widely recognized indices. There is no representation that such index is an appropriate benchmark for such comparison.
This material (or any portion thereof) may not be copied or distributed without Newton’s prior written approval.


