1-3-1 block

Lorem ipsum dolor sit amet, consectetur adipiscing elit, sed do eiusmod tempor incididunt ut labore et dolore magna aliqua. Ut enim ad minim veniam, quis nostrud exercitation ullamco laboris nisi ut aliquip ex ea commodo consequat. Duis aute irure dolor in reprehenderit in voluptate velit esse cillum dolore eu fugiat nulla pariatur. Excepteur sint occaecat cupidatat non proident, sunt in culpa qui officia deserunt mollit anim id est laborum.

  • Person, Human, Apparel

    Lorem ipsum dolor sit amet, consectetur adipiscing elit, sed do eiusmod tempor incididunt ut labore et dolore.
  • Report icon
    Lorem ipsum dolor sit amet, consectetur adipiscing elit, sed do eiusmod tempor incididunt ut labore et dolore magna aliqua. Ut enim ad minim veniam, quis nostrud exercitation ullamco labo

4-2-1 block

  • Person, Human, Apparel

    Lorem ipsum dolor sit amet, consectetur adipiscing elit, sed do eiusmod tempor incididunt ut labore
  • Atom icon
    Lorem ipsum dolor sit amet, consectetur adipiscing elit, sed do eiusmod tempor incididunt ut labore
  • Report icon
    Lorem ipsum dolor sit amet, consectetur adipiscing elit, sed do eiusmod tempor incididunt ut labore
  • Location icon
    Lorem ipsum dolor sit amet, consectetur adipiscing elit, sed do eiusmod tempor incididunt ut labore
  • Person, Human, Apparel

  • Diversity engagement and voting policy
    Lorem ipsum dolor sit amet, consectetur adipiscing elit, sed do eiusmod tempor incididunt ut laboreLorem ipsum dolor sit amet, consectetur adipiscing elit, sed do eiusmod tempor incididunt ut laboreLorem ipsum dolor sit amet, consectetur adipiscing elit, sed do eiusmod tempor incididunt ut labore

4-2-1 block with 3 elements

  • Location icon
    Lorem ipsum dolor sit amet, consectetur adipiscing elit, sed do eiusmod tempor incididunt ut labore
  • Atom icon
    Name
    Title
  • Report icon
    Lorem ipsum dolor sit amet, consectetur adipiscing elit, sed do eiusmod tempor incididunt ut labore

Filterable Archive block

Filter by:
Topic
Author
loading-newton

Lorem ipsum dolor sit amet, consectetur adipiscing elit, sed do eiusmod tempor incididunt ut labore Lorem ipsum dolor sit amet, consectetur adipiscing elit, sed do eiusmod tempor incididunt ut labore Lorem ipsum dolor sit amet, consectetur adipiscing elit, sed do eiusmod tempor incididunt ut labore

44
years of experience
18
years at Newton

Net effects

The world has made the transition from connecting places to connecting people to connecting devices. The rapid rise in the ‘internet of things’ is transforming lifestyles and business. This creates winners and losers – our ‘net effects’ theme seeks to identify them.

China influence

The influence of China on the world has grown exponentially but its economy looks increasingly risky. ‘China influence’ looks at how the country’s development affects the investment outlook beyond its borders.1

1 Compared to more established economies, the value of investments in emerging markets may be subject to greater volatility owing to differences in generally accepted accounting principles or from economic or political instability or less developed market practices.

Financialisation

Cheap money has caused rapid growth in a sector already supported by deregulation. ‘Financialisation’ investigates the implications of finance dominating economic activity, instead of serving it.

Smart revolution

Machines and networks are becoming more intelligent. This is disrupting the labour market, as machines increasingly replace humans in the workplace. ‘Smart revolution’ considers the implications commercially, socially and politically.

Earth matters

Environmental factors are high up the political agenda and provide areas of opportunity as well as risk. Governments are under pressure to respond but this can be expensive, despite advancements in technology. ‘Earth matters’ looks at these issues.

State intervention

Authorities have engaged in ever-greater policy intervention and regulation to shore up economic growth. We believe ‘state intervention’ has increased misallocation of capital, caused volatility in markets and inflated asset prices – and we think that calls for a stock-specific approach.

In cascade mode:

Trevor Holder

Portfolio manager, fixed income

Alex Khosla

Portfolio manager, global opportunities team

Matthew Jenkin

Research analyst, equity research team

Ulsbold Harper

Principal, institutional business development

Tony Gao

Associate portfolio manager

William Cazalet

Global investment strategist

Welcome to WordPress. This is your first post. Edit or delete it, then start blogging!

Welcome to WordPress. This is your first post. Edit or delete it, then start blogging!

Welcome to WordPress. This is your first post. Edit or delete it, then start blogging!

Welcome to WordPress. This is your first post. Edit or delete it, then start blogging!

Welcome to WordPress. This is your first post. Edit or delete it, then start blogging!

Welcome to WordPress. This is your first post. Edit or delete it, then start blogging!

Welcome to WordPress. This is your first post. Edit or delete it, then start blogging!

Welcome to WordPress. This is your first post. Edit or delete it, then start blogging!

Welcome to WordPress. This is your first post. Edit or delete it, then start blogging!

Welcome to WordPress. This is your first post. Edit or delete it, then start blogging!

Welcome to WordPress. This is your first post. Edit or delete it, then start blogging!

Welcome to WordPress. This is your first post. Edit or delete it, then start blogging!

Contacts block

Optional text here – can select up to 4 individuals – no more.

Lorem ipsum dolor sit amet, consectetur adipiscing elit, sed do eiusmod tempor incididunt ut labore et dolore magna aliqua. Ut enim ad minim veniam, quis nostrud exercitation ullamco laboris nisi ut aliquip ex ea commodo consequat.

In carousel mode:

Press and Events Teaser

Press Releases

Media contacts

London

Pardot – dynamic content

Pardot – form

This form used a Pardot template that applies a black font colour and grey background. This is iframed into the page.

Fund charges grid

Fund / share class name Ongoing costs % Ex-ante transaction costs % Total costs & charges %
Annual Management Charge Other costs & charges Ongoing Charges Figure
BNY Mellon 50 50 Global Equity Fund
0.60 0.10 0.70 0.08 0.78
BNY Mellon Asian Income Fund
0.00 0.09 0.09 0.10 0.19
BNY Mellon Asian Opportunities Fund
0.50 0.08 0.58 0.35 0.93
BNY Mellon Global Dynamic Bond Fund
0.40 0.05 0.45 0.26 0.71
0.00 0.05 0.05 0.26 0.31
0.00 0.05 0.05 0.26 0.31
0.00 0.05 0.05 0.26 0.31
0.40 0.05 0.45 0.26 0.71
0.00 0.05 0.05 0.26 0.31
BNY Mellon Global Dynamic Bond Income Fund
0.40 0.06 0.46 0.24 0.70
0.00 0.06 0.06 0.24 0.30
BNY Mellon Global Emerging Markets Opportunities Fund
1.50 0.19 1.69 0.44 2.13
0.75 0.12 0.87 0.44 1.31
0.00 0.12 0.12 0.44 0.56
BNY Mellon Global Equity Fund
0.60 0.04 0.64 0.08 0.72
0.50 0.04 0.54 0.08 0.62
0.75 0.04 0.79 0.08 0.87
BNY Mellon Global High Yield Bond Fund
0.00 0.09 0.09 0.01 0.10
0.00 0.09 0.09 0.01 0.10
BNY Mellon Global Income Fund
0.75 0.04 0.79 0.18 0.97
0.00 0.04 0.04 0.18 0.22
0.75 0.04 0.79 0.18 0.97
0.00 0.04 0.04 0.18 0.22
BNY Mellon Global Opportunities Fund
0.75 0.08 0.83 0.13 0.96
0.00 0.08 0.08 0.13 0.21
BNY Mellon Index Linked Gilt Fund
0.20 0.08 0.28 0.00 0.28
BNY Mellon International Bond Fund
0.30 0.08 0.38 0.20 0.58
BNY Mellon Long Gilt Fund
0.20 0.09 0.29 0.00 0.29
0.00 0.09 0.09 0.00 0.09
BNY Mellon Multi-Asset Diversified Return Fund
0.00 0.06 0.06 0.05 0.11
0.45 0.06 0.51 0.05 0.56
BNY Mellon Multi-Asset Global Balanced Fund
0.45 0.05 0.50 0.08 0.58
0.60 0.05 0.65 0.08 0.73
BNY Mellon Multi-Asset Income Fund
0.00 0.13 0.13 0.05 0.18
0.45 0.05 0.50 0.05 0.55
BNY Mellon Real Return Fund
0.75 0.04 0.79 0.34 1.13
0.00 0.04 0.04 0.34 0.38
0.00 0.04 0.04 0.34 0.38
0.75 0.04 0.79 0.34 1.13
0.65 0.04 0.69 0.34 1.03
0.60 0.04 0.64 0.34 0.98
BNY Mellon Sustainable European Opportunities Fund
0.50 0.09 0.59 0.20 0.79
BNY Mellon Sustainable Global Dynamic Bond Fund
0.50 0.10 0.60 0.17 0.77
0.40 0.05 0.45 0.17 0.62
0.00 0.05 0.05 0.17 0.22
0.00 0.05 0.05 0.17 0.22
BNY Mellon Sustainable Global Equity Fund
0.00 0.05 0.05 0.07 0.12
BNY Mellon Sustainable Global Equity Income Fund
0.75 0.10 0.85 0.21 1.06
0.75 0.10 0.85 0.21 1.06
0.00 0.05 0.05 0.21 0.26
BNY Mellon Sustainable Real Return Fund
0.65 0.05 0.70 0.29 0.99
0.55 0.05 0.60 0.29 0.89
BNY Mellon Sustainable Sterling Bond Fund
0.50 0.14 0.64 0.00 0.64
0.20 0.08 0.28 0.00 0.28
0.00 0.08 0.08 0.00 0.08
BNY Mellon Sustainable UK Opportunities Fund
0.75 0.05 0.80 0.24 1.04
BNY Mellon UK Equity Fund
0.00 0.04 0.04 0.13 0.17
0.50 0.04 0.54 0.13 0.67
BNY Mellon UK Income Fund
0.50 0.04 0.54 0.31 0.85
0.00 0.04 0.04 0.31 0.35
0.00 0.04 0.04 0.31 0.35
Newton Managed Targeted Return Fund
0.00 0.12 0.12 0.03 0.15

Fund performance grid

Quarterly Annualised to Sep 20 Rolling 12-month periods
Fund / share class name Inception Date Q3 2020 Q2 2020 Q1 2020 Q4 2019 3 Years 5 Years 10 Years SI Sep 19
to
Sep 20
Sep 18
to
Sep 19
Sep 17
to
Sep 18
Sep 16
to
Sep 17
Sep 15
to
Sep 16
BNY Mellon 50/50 Global Equity
01 Mar 06 1.96 16.69 -21.71 2.87 3.47 7.76 7.05 6.28 -4.19 7.45 7.58 8.42 21.00
0.12 14.69 -20.31 2.80 2.11 8.52 7.76 6.39 -5.92 4.64 8.15 14.53 23.44
1.84 1.99 -1.40 0.07 1.36 -0.76 -0.72 -0.10 1.74 2.82 -0.57 -6.11 -2.44
15 Feb 99 1.98 16.71 -21.69 2.89 3.57 7.87 7.15 6.17 -4.09 7.57 7.69 8.54 21.10
0.12 14.69 -20.31 2.80 2.11 8.52 7.76 5.72 -5.92 4.64 8.15 14.53 23.44
1.86 2.02 -1.38 0.09 1.46 -0.65 -0.61 0.45 1.83 2.93 -0.46 -5.99 -2.34
BNY Mellon Asian Income
30 Nov 05 0.97 14.52 -20.77 0.17 3.31 10.37 8.50 10.86 -8.23 11.88 7.40 6.34 39.69
4.64 19.76 -15.80 2.76 5.91 13.71 7.42 10.06 8.42 4.12 5.22 15.75 38.24
-3.67 -5.23 -4.97 -2.59 -2.60 -3.33 1.08 0.80 -16.66 7.76 2.18 -9.41 1.45
BNY Mellon Continental European
31 Aug 00 -0.03 19.54 -14.87 -0.18 4.07 10.05 8.42 6.07 1.55 5.44 5.26 16.22 23.22
1.41 18.87 -17.49 0.91 2.88 10.11 7.80 5.21 0.37 6.35 2.01 22.70 21.13
-1.44 0.68 2.62 -1.09 1.19 -0.06 0.62 0.87 1.18 -0.91 3.24 -6.48 2.09
BNY Mellon Global Dynamic Bond*
30 Apr 06 1.38 3.41 -3.29 -0.08 2.14 2.53 3.19 5.26 1.31 5.89 -0.66 1.63 4.62
0.51 0.53 0.64 0.68 2.55 2.49 2.52 3.64 2.39 2.73 2.53 2.31 2.51
0.87 2.88 -3.93 -0.76 -0.41 0.04 0.67 1.62 -1.08 3.16 -3.19 -0.68 2.12
18 Feb 11 1.47 3.51 -3.20 0.03 2.55 2.94 3.67 1.71 6.31 -0.26 2.04 5.04
0.51 0.53 0.64 0.68 2.55 2.49 2.51 2.39 2.73 2.53 2.31 2.51
0.97 2.98 -3.84 -0.66 0.00 0.45 1.16 -0.68 3.58 -2.79 -0.27 2.54
BNY Mellon Global Dynamic Bond Income
09 May 16 2.32 6.16 -5.97 -0.02 2.73 3.22 2.12 7.02 -0.79 2.07
BNY Mellon Global Emerging Markets
27 Jul 15 16.30 27.50 -12.27 4.97 11.29 18.52 15.40 36.55 6.71 -5.41 18.64 42.98
4.71 18.50 -18.37 4.03 3.69 12.41 9.90 5.37 3.69 2.05 18.57 35.81
11.59 9.00 6.10 0.94 7.60 6.10 5.50 31.19 3.02 -7.45 0.07 7.18
BNY Mellon Global Equity
10 Feb 06 3.06 17.83 -12.36 0.92 10.09 13.22 11.15 8.18 7.40 8.02 15.01 8.43 28.57
3.35 19.64 -15.99 1.35 8.45 13.85 10.72 8.36 5.27 7.28 12.94 14.88 30.55
-0.29 -1.81 3.62 -0.42 1.64 -0.64 0.43 -0.18 2.13 0.74 2.07 -6.44 -1.99
07 Oct 04 3.03 17.80 -12.39 0.90 9.98 13.10 11.07 9.65 7.30 7.91 14.90 8.33 28.44
3.35 19.64 -15.99 1.35 8.45 13.85 10.72 9.56 5.27 7.28 12.94 14.88 30.55
-0.31 -1.84 3.60 -0.45 1.53 -0.75 0.35 0.09 2.02 0.63 1.96 -6.55 -2.11
02 Feb 09 3.00 17.76 -12.42 0.86 9.82 12.94 10.99 12.15 7.13 7.75 14.73 8.16 28.27
3.35 19.64 -15.99 1.35 8.45 13.85 10.72 12.28 5.27 7.28 12.94 14.88 30.55
-0.35 -1.88 3.57 -0.49 1.37 -0.91 0.27 -0.13 1.86 0.47 1.79 -6.71 -2.29
10 Sep 07 3.19 17.97 -12.25 1.05 10.64 13.78 11.74 9.67 7.94 8.56 15.59 8.97 29.21
3.35 19.64 -15.99 1.35 8.45 13.85 10.72 8.65 5.27 7.28 12.94 14.88 30.55
-0.16 -1.66 3.73 -0.30 2.19 -0.07 1.02 1.01 2.67 1.28 2.65 -5.91 -1.34
BNY Mellon Global High Yield Bond
19 Mar 08 3.28 9.70 -10.20 1.02 3.79 6.30 4.87 6.50 2.78 8.08 0.65 6.47 14.02
3.85 10.98 -14.21 2.51 2.53 5.80 5.93 7.91 1.36 5.44 0.84 8.40 13.45
-0.57 -1.29 4.01 -1.49 1.26 0.50 -1.07 -1.41 1.42 2.63 -0.20 -1.93 0.57
26 May 11 2.98 8.98 -10.77 0.74 2.41 5.03 3.48 0.88 6.88 -0.38 5.41 12.89
3.85 10.98 -14.21 2.51 2.53 5.80 5.40 1.36 5.44 0.84 8.40 13.45
-0.87 -2.00 3.43 -1.77 -0.12 -0.77 -1.92 -0.48 1.44 -1.22 -2.99 -0.56
BNY Mellon Global Income
14 Feb 13 -1.23 12.13 -16.00 -1.23 5.03 11.37 9.72 -8.11 13.43 11.16 7.58 37.48
3.22 19.92 -16.14 1.39 9.05 14.45 12.18 5.24 7.93 14.16 15.43 31.18
-4.45 -7.79 0.14 -2.61 -4.02 -3.07 -2.46 -13.35 5.50 -3.00 -7.84 6.30
08 Oct 10 -1.04 12.29 -15.83 -1.03 5.75 12.39 11.89 -7.43 14.19 11.89 8.38 39.88
3.22 19.92 -16.14 1.39 9.05 14.45 12.10 5.24 7.93 14.16 15.43 31.18
-4.25 -7.64 0.31 -2.42 -3.29 -2.06 -0.21 -12.68 6.26 -2.26 -7.05 8.70
BNY Mellon Global Opportunities
01 Jul 05 1.47 18.73 -15.41 1.48 9.03 12.64 10.89 10.04 3.42 9.74 14.21 6.79 31.00
3.35 19.64 -15.99 1.35 8.45 13.85 10.93 9.49 5.27 7.28 12.94 14.88 30.55
-1.88 -0.91 0.58 0.13 0.58 -1.21 -0.04 0.55 -1.86 2.45 1.27 -8.09 0.45
13 Dec 06 1.66 18.95 -15.25 1.67 9.86 13.49 11.73 9.74 4.20 10.57 15.08 7.60 31.98
3.35 19.64 -15.99 1.35 8.45 13.85 10.93 8.90 5.27 7.28 12.94 14.88 30.55
-1.69 -0.69 0.74 0.32 1.41 -0.36 0.80 0.84 -1.08 3.28 2.14 -7.27 1.43
BNY Mellon Index Linked Gilt
23 Feb 98 -2.23 11.23 2.45 -8.80 7.25 8.45 8.63 7.80 1.61 20.02 1.16 -3.76 26.38
-2.47 11.54 1.89 -9.41 6.99 8.29 8.81 7.80 0.42 20.28 1.41 -4.23 26.95
0.23 -0.31 0.56 0.61 0.26 0.16 -0.18 0.00 1.20 -0.26 -0.25 0.47 -0.58
BNY Mellon International Bond
18 May 07 -1.20 3.18 8.42 -7.39 6.25 7.77 4.28 7.12 2.35 15.69 1.30 -5.42 28.14
-2.00 1.82 10.15 -7.47 5.79 7.26 4.08 7.21 1.70 15.05 1.19 -6.08 27.66
0.80 1.37 -1.73 0.07 0.46 0.51 0.20 -0.09 0.65 0.64 0.11 0.67 0.48
BNY Mellon Long Corporate Bond
29 Jun 00 0.71 9.45 -2.72 -1.54 6.75 7.60 7.47 7.07 5.57 14.87 0.32 -1.45 20.28
1.00 10.87 -4.15 -1.63 7.21 7.96 7.68 7.35 5.58 16.84 -0.11 -2.23 21.76
-0.29 -1.42 1.44 0.08 -0.45 -0.37 -0.21 -0.28 0.00 -1.97 0.43 0.78 -1.49
09 May 05 0.68 9.42 -2.74 -1.57 6.65 7.49 7.36 6.57 5.47 14.75 0.22 -1.54 20.16
1.00 10.87 -4.15 -1.63 7.21 7.96 7.68 6.85 5.58 16.84 -0.11 -2.23 21.76
-0.32 -1.45 1.41 0.06 -0.56 -0.48 -0.31 -0.27 -0.11 -2.08 0.33 0.69 -1.61
BNY Mellon Long Gilt
01 Feb 98 -2.03 3.82 10.58 -6.22 9.06 8.49 8.53 7.47 5.49 21.85 0.92 -6.13 23.40
-2.47 3.85 11.21 -6.58 9.46 8.61 8.72 7.42 5.22 22.98 1.35 -6.30 23.01
0.44 -0.03 -0.62 0.36 -0.40 -0.13 -0.18 0.05 0.26 -1.12 -0.43 0.17 0.39
BNY Mellon Multi-Asset Diversified Return**
30 Sep 15 3.14 13.76 -14.04 1.94 4.07 6.81 6.80 2.82 8.14 1.36 8.78 13.37
0.76 0.78 0.89 0.93 3.56 3.50 3.49 3.40 3.74 3.53 3.31 3.52
2.39 12.98 -14.93 1.01 0.51 3.31 3.30 -0.58 4.41 -2.18 5.47 9.86
01 Feb 08 3.11 13.72 -14.08 1.90 3.22 6.21 5.25 4.55 2.66 4.62 2.40 8.59 13.18
0.76 0.78 0.89 0.93 3.56 3.50 3.54 3.91 3.40 3.74 3.53 3.31 3.52
2.35 12.94 -14.96 0.97 -0.33 2.71 1.70 0.63 -0.74 0.89 -1.13 5.28 9.66
BNY Mellon Multi-Asset Global Balanced
23 Sep 98 1.22 12.14 -12.25 0.74 5.78 9.04 7.32 7.71 0.34 8.45 8.78 8.39 20.15
-0.01 11.99 -14.03 1.28 4.02 7.75 7.22 6.46 -2.51 6.97 7.91 9.52 17.82
1.23 0.15 1.78 -0.54 1.76 1.29 0.11 1.25 2.84 1.48 0.87 -1.13 2.32
14 Apr 05 1.18 12.09 -12.28 0.70 5.62 8.89 7.21 8.35 0.19 8.28 8.62 8.23 20.03
-0.01 11.99 -14.03 1.28 4.02 7.75 7.22 7.38 -2.51 6.97 7.91 9.52 17.82
1.19 0.11 1.75 -0.58 1.60 1.14 -0.01 0.97 2.69 1.31 0.70 -1.29 2.20
BNY Mellon Multi-Asset Income
04 Sep 17 1.13 13.84 -19.66 4.02 0.89 0.45 -3.79 3.48 3.16
BNY Mellon Oriental
01 Aug 00 17.53 26.77 -8.67 6.20 13.79 18.28 7.66 10.67 44.52 5.74 -3.58 14.43 37.32
4.64 19.76 -15.80 2.76 5.91 13.71 7.42 9.57 8.42 4.12 5.22 15.75 38.24
12.90 7.02 7.13 3.44 7.89 4.58 0.25 1.10 36.10 1.62 -8.80 -1.33 -0.92
BNY Mellon Real Return***
29 Feb 12 3.47 8.20 -9.14 1.60 4.57 4.26 3.72 3.34 8.71 1.79 -2.74 10.79
1.00 1.02 1.12 1.12 4.51 4.45 4.60 4.34 4.69 4.52 4.23 4.46
2.47 7.18 -10.27 0.48 0.06 -0.18 -0.87 -0.99 4.02 -2.73 -6.97 6.32
28 Oct 04 3.45 8.17 -9.16 1.58 4.49 4.18 3.73 6.49 3.26 8.61 1.72 -2.82 10.69
1.00 1.02 1.12 1.12 4.51 4.45 4.61 5.86 4.34 4.69 4.52 4.23 4.46
2.45 7.16 -10.29 0.46 -0.02 -0.27 -0.88 0.63 -1.08 3.93 -2.80 -7.05 6.23
10 Apr 17 3.48 8.21 -9.14 1.61 4.62 3.99 3.39 8.76 1.84
1.00 1.02 1.12 1.12 4.51 4.50 4.34 4.69 4.52
2.48 7.19 -10.26 0.49 0.11 -0.51 -0.95 4.07 -2.67
01 Mar 06 3.61 8.34 -9.03 1.73 5.16 4.89 4.47 6.05 3.88 9.27 2.45 -2.09 11.52
1.00 1.02 1.12 1.12 4.51 4.45 4.61 5.58 4.34 4.69 4.52 4.23 4.46
2.60 7.32 -10.15 0.61 0.65 0.45 -0.14 0.47 -0.45 4.58 -2.07 -6.32 7.06
BNY Mellon Sustainable Global Equity
22 Jan 18 4.81 20.16 -9.94 0.72 15.72 14.25 14.84
3.35 19.64 -15.99 1.35 6.48 5.27 7.28
1.46 0.53 6.05 -0.63 9.24 8.97 7.56
BNY Mellon Sustainable Real Return****
24 Apr 18 4.50 8.65 -8.48 1.41 7.43 5.37 8.58
1.00 1.02 1.12 1.12 4.65 4.34 4.69
3.49 7.64 -9.61 0.28 2.78 1.03 3.89
BNY Mellon UK Equity
02 Apr 12 -0.96 10.02 -22.01 2.88 -0.44 3.57 6.59 -12.57 6.22 6.25 5.86 14.07
-2.92 10.17 -25.13 4.16 -3.21 3.47 4.80 -16.59 2.68 5.87 11.94 16.82
1.96 -0.15 3.12 -1.27 2.77 0.10 1.78 4.03 3.54 0.38 -6.08 -2.75
BNY Mellon UK Income
11 Oct 02 -4.41 8.82 -22.98 4.84 -1.98 3.23 5.84 7.70 -16.00 5.92 5.85 1.58 22.53
-2.92 10.17 -25.13 4.16 -3.21 3.47 5.06 6.83 -16.59 2.68 5.87 11.94 16.82
-1.48 -1.35 2.15 0.68 1.23 -0.24 0.78 0.86 0.60 3.24 -0.02 -10.36 5.71
BNY Mellon UK Opportunities
31 Jan 05 -1.06 12.40 -24.09 3.56 -0.52 3.61 7.27 8.05 -12.57 7.91 4.35 3.87 16.78
-2.92 10.17 -25.13 4.16 -3.21 3.47 5.06 5.63 -16.59 2.68 5.87 11.94 16.82
1.86 2.23 1.05 -0.60 2.69 0.15 2.21 2.41 4.02 5.23 -1.51 -8.07 -0.04
Newton Managed Targeted Return
31 Mar 14 -0.05 5.15 -4.50 0.78 2.74 4.51 3.72 1.15 3.92 3.17 0.44 14.46
1.54 1.01 1.21 1.30 6.35 6.63 6.32 5.16 6.52 7.38 7.99 6.13
-1.58 4.13 -5.71 -0.52 -3.61 -2.12 -2.60 -4.01 -2.60 -4.22 -7.55 8.33
31 Mar 14 0.09 5.28 -4.38 0.91 3.28 5.06 4.29 1.68 4.47 3.70 0.97 15.05
1.54 1.01 1.21 1.30 6.35 6.63 6.32 5.16 6.52 7.38 7.99 6.13
-1.45 4.27 -5.59 -0.39 -3.07 -1.58 -2.03 -3.48 -2.05 -3.68 -7.02 8.92

Prices grid

Past or current yields are not indicative of future yields.
All shareclasses are
Fund name Price Currency Valuation date Yield Note Change
BNY Mellon 50/50 Global Equity Fund
3.9186GBP26/04/20241.71XD0.0081
5.3447GBP26/04/20241.80XD0.0109
BNY Mellon Asian Income Fund
2.5546GBP26/04/20243.97XD0.0019
BNY Mellon Global Dynamic Bond Fund
2.0548GBP26/04/20245.20XD-0.0033
0.8397GBP26/04/20245.20XD-0.0014
2.1659GBP26/04/20245.14XD-0.0034
0.8744GBP26/04/20245.14XD-0.0013
0.0000GBP16/01/20240.00XD-1.7927
0.8939GBP26/04/20245.14XD-0.0014
BNY Mellon Global Dynamic Bond Income Fund
0.8076GBP26/04/20245.57XD-0.0018
0.8336GBP26/04/20245.57XD-0.0018
BNY Mellon Global Emerging Markets Opportunities Fund
2.2705GBP26/04/20240.72XD0.0136
2.1826GBP26/04/20240.00XD0.013
10.2214GBP26/04/20241.46XD0.0615
BNY Mellon Global Equity Fund
4.5688GBP26/04/20240.78XD0.007
6.4478GBP26/04/20240.90XD0.0099
4.7469GBP26/04/20240.98XD0.0074
BNY Mellon Global High Yield Bond Fund
1.3908GBP26/04/20246.33XD0.0027
0.6965GBP26/04/20246.33XD0.0013
BNY Mellon Global Income Fund
2.9900GBP26/04/20243.19XD-0.0012
3.0203GBP26/04/20243.26XD-0.0013
6.3804GBP26/04/20243.18XD-0.0025
2.7094GBP26/04/20243.25XD-0.0011
BNY Mellon Global Opportunities Fund
6.1802GBP26/04/20240.38XD0.0136
7.0136GBP26/04/20241.00XD0.0156
BNY Mellon Index Linked Gilt Fund
3.3594GBP26/04/20244.65-0.0032
BNY Mellon International Bond Fund
2.0389GBP26/04/20243.25-0.0091
BNY Mellon Long Gilt Fund
3.8755GBP26/04/20244.25XD-0.0085
4.0109GBP26/04/20244.46XD-0.0089
BNY Mellon Multi-Asset Diversified Return Fund
1.4261GBP26/04/20243.600.0033
BNY Mellon Multi-Asset Global Balanced Fund
4.6970GBP26/04/20241.70XD0.0012
7.0264GBP26/04/20241.81XD0.0017
BNY Mellon Multi-Asset Income Fund
1.0453GBP26/04/20244.40XD0.0029
1.0943GBP26/04/20244.39XD0.0031
BNY Mellon Real Return Fund
2.9921GBP26/04/20242.79XD-0.0021
2.0706GBP26/04/20242.85XD-0.0015
1.4970GBP26/04/20242.79XD-0.001
1.0401GBP26/04/20242.85-0.0008
1.2560GBP26/04/20242.79XD-0.0009
2.5748GBP26/04/20242.78XD-0.0017
1.4656GBP26/04/20242.84XD-0.001
BNY Mellon Sustainable Global Dynamic Bond Fund
1.0064GBP26/04/20245.14-0.0016
1.0005GBP26/04/20245.14-0.0015
1.0239GBP26/04/20245.14-0.0016
0.8999GBP26/04/20245.14-0.0013
BNY Mellon Sustainable Global Emerging Markets Fund
0.8154GBP26/04/20240.430.006
0.8084GBP26/04/20240.490.0059
BNY Mellon Sustainable Global Equity Fund
1.8574GBP26/04/20241.20XD-0.0011
BNY Mellon Sustainable Global Equity Income Fund
1.3588GBP26/04/20243.09-0.0025
1.1883GBP26/04/20243.16-0.0022
1.2396GBP26/04/20243.17-0.0023
BNY Mellon Sustainable Real Return Fund
1.2130GBP26/04/20242.83XD-0.0017
1.2187GBP26/04/20242.83XD-0.0017
BNY Mellon Sustainable UK Opportunities Fund
3.7360GBP26/04/20241.39XD0.0002
BNY Mellon UK Equity Fund
6.5856GBP26/04/20242.60XD0.0047
BNY Mellon UK Income Fund
6.5169GBP26/04/20243.99XD0.0317
7.0768GBP26/04/20243.98XD0.0345
1.7537GBP26/04/20244.09XD0.0085

Solutions List Block – list or card view – teaser images optional

Tabbed content

Tab 1
Sub-title


Lorem ipsum dolor sit amet, consectetur adipiscing elit, sed do eiusmod tempor incididunt ut labore Lorem ipsum dolor sit amet, consectetur adipiscing elit, sed do eiusmod tempor incididunt ut labore Lorem ipsum dolor sit amet, consectetur adipiscing elit, sed do eiusmod tempor incididunt ut labore

Tab 2
Subtitle

Lorem ipsum dolor sit amet, consectetur adipiscing elit, sed do eiusmod tempor incididunt ut labore Lorem ipsum dolor sit amet, consectetur adipiscing elit, sed do eiusmod tempor incididunt ut labore Lorem ipsum dolor sit amet, consectetur adipiscing elit, sed do eiusmod tempor incididunt ut labore Lorem ipsum dolor sit amet, consectetur adipiscing elit, sed do eiusmod tempor incididunt ut labore

Transcript

Transcript can go here…..

Section Content block with embedded videos

Left side
Right side
Video embedded on the right.
Video embedded on the left.

Section content block

Text section

Person, Human, Apparel

Lorem ipsum dolor sit amet, consectetur adipiscing elit, sed do eiusmod tempor incididunt ut labore et dolore magna aliqua. Ut enim ad minim veniam, quis nostrud exercitation ullamco laboris nisi ut aliquip ex ea commodo consequat.
Amazon case study
Lorem ipsum dolor sit amet, consectetur adipiscing elit, sed do eiusmod tempor incididunt ut labore et dolore magna aliqua. Ut enim ad minim veniam, quis nostrud exercitation ullamco laboris nisi ut aliquip ex ea commodo consequat.

Text section

Lorem ipsum dolor sit amet, consectetur adipiscing elit, sed do eiusmod tempor incididunt ut labore et dolore magna aliqua. Ut enim ad minim veniam, quis nostrud exercitation ullamco laboris nisi ut aliquip ex ea commodo consequat. Lorem ipsum dolor sit amet, consectetur adipiscing elit, sed do eiusmod tempor incididunt ut labore et dolore magna aliqua. Ut enim ad minim veniam, quis nostrud exercitation ullamco laboris nisi ut aliquip ex ea commodo consequat.

List section

List title goes here
  • 1
  • 2
  • 3

Table section

FundMar
2020
Jun
2020
Sep
2020
Dec
2020
Real Return4.1%4.1%4.1%4.1%

Text section

Lorem ipsum dolor sit amet, consectetur adipiscing elit, sed do eiusmod tempor incididunt ut labore et dolore magna aliqua.
Sed do eiusmod tempor incididunt ut labore et dolore magna aliqua.
Amazon case study
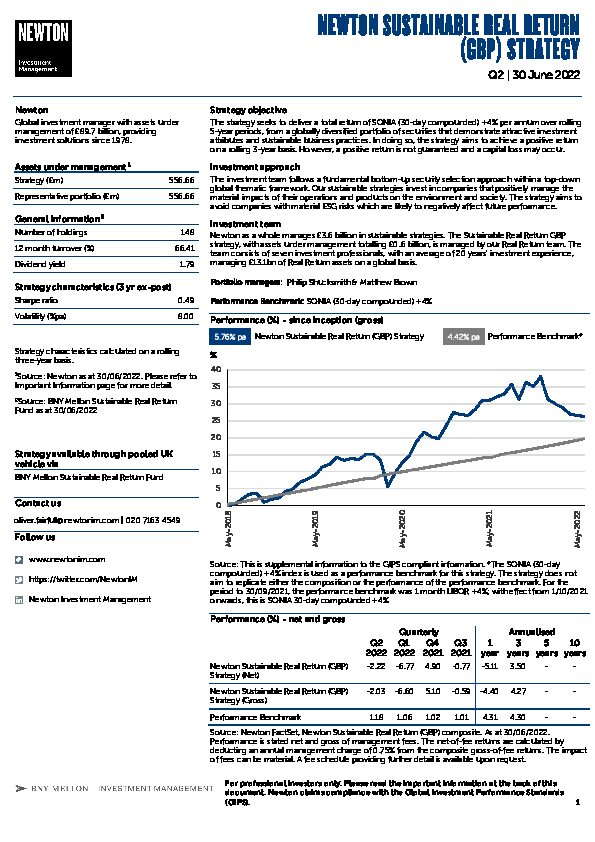
UK Inst Sustainable Real Return strategy factsheet

Factsheet

Text description.


Real Return Brochure

Brochure

Description goes here.

H4 heading

More text – free format.


Lorem ipsum dolor sit amet, consectetur adipiscing elit, sed do eiusmod tempor incididunt ut labore et dolore magna aliqua. Ut enim ad minim veniam, quis nostrud exercitation ullamco laboris nisi ut aliquip ex ea commodo consequat.


More text

Section content block

Text section

This is just text:

– Our approach to stewardship
– How we hold ourselves to account
– How we help to shape policy and best practice
– How we incorporate ESG considerations into our investment process
– Our engagement and voting activity
Amazon case study

List section

List heading
  • item
  • item
  • item

New table

12
34

New list

Title
  • item
  • item
  • item

New text

Lorem ipsum dolor sit amet, consectetur adipiscing elit, sed do eiusmod tempor incididunt ut labore et dolore magna aliqua.

Sed do eiusmod tempor incididunt ut labore et dolore magna aliqua.

This is a separate 1-3-1 block with no block title, just a button. Using the same background colour as the block above makes it look like part of the same content.

Solutions profile block

Section title

Person, Human, Apparel
As per block above

Heading

Paragraph text.