
Something doesn’t seem right in the world of central banking – prices are not doing what they’re supposed to, or at least what the central banks’ carefully calibrated models suggest they should be doing. The impudence! According to the Phillips curve, a mainstay of the central-bank toolkit, as unemployment falls inflation should rise. But the consumer price index (CPI) numbers just aren’t playing ball.
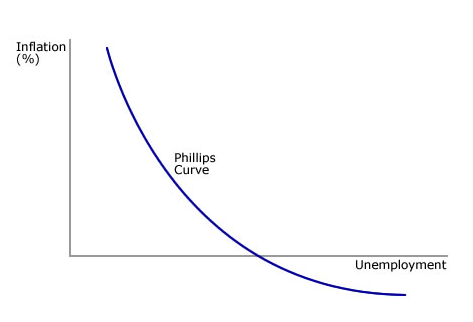
The Phillips Curve
Since 1958, when William Phillips published his seminal paper,[1] a wide body of research has emphasized the role of economic slack in driving inflation in prices and wages. In essence, this is a supply and demand story; as demand for labor increases relative to supply, unemployment will fall and businesses have to stump up higher wages to get the labor they need (see below). Higher wages increase unit labor costs, thus eroding profit margins and causing businesses to increase prices. However, wage growth does not necessarily lead to higher unit labor costs. If a company is able to increase productivity, thereby reducing costs per unit, it is conceivable that some of the cost saving can be shared with labor in the form of higher wages without reducing profit margins. Thus a conventional Phillips curve (see below) embodies the view that as economic slack declines and unemployment falls, productivity gains aside, unit labor costs will rise, prompting businesses to increase prices.
Source: Newton
While the Phillips curve may have done a decent job of explaining inflation over the period for which William Phillips first calibrated his model, recent evidence suggests to us that its powers of prediction have waned, particularly in the aftermath of the global financial crisis. Has the relationship between inflation and the labor market weakened so much that a continued tightening of labor markets poses little threat of a material acceleration of inflation?
In the U.S., Germany, Japan and the UK, where unemployment is at levels that historically indicated a lack of economic slack, subdued wage growth and inflation is widely attributed to a decline in labor pricing power. But this is by no means a recent phenomenon.
Factors Behind Labor’s Declining Pricing Power
Global labor markets have seen profound changes over the last few decades. In developed economies, large swathes of the workforce have seen their pricing power eroded on a multi-decade basis, suggesting structural forces are at play. Two in particular warrant highlighting.
First, the opening up of the former Soviet bloc and China joining the World Trade Organization (WTO) led to a dramatic expansion of the global labor force, roughly doubling the effective labor force involved in world trade. Corporations took advantage of this economic integration to expand global supply chains and substitute labor in advanced economies for relatively cheaper labor in less developed economies.
A second factor has been the adoption of labor-saving technologies. The implementation of new technologies to reduce demand for labor is nothing new, but it has had a significant impact on the demand for skilled labor in developed economies. At the same time, technologies of the information revolution mean that many types of service-sector employment, traditionally a mainstay of many white-collar middle-income jobs, are now threatened with obsolescence. In the U.S. for example, the e-commerce industry requires only 0.9 workers to generate $1m of revenues, whereas traditional bricks-and-mortar retailers require 3.5.[2]
Natural Disinflation
It should also be noted that, despite the central-bank fetish with inflation targeting, supposedly in pursuit of economic stability,[3] a free-market economy where the forces of creative destruction are at work is naturally predisposed towards disinflationary pressures over the long term.
To take one example, technological progress has realized a decline in the cost of producing light that is difficult to grasp. The environmental economists Roger Fouquet and Peter Pearson have retraced this development in England.[4] One hour of light (referred to as the quantity of light shed by a 100-watt bulb in one hour) cost 3,200 times as much in 1800 in England as it does today, amounting to just over 150 of today’s U.S. dollars. In 1900, it still cost around 5 dollars. By 2000 the cost was 5 U.S. cents.
This technological advance can also be thought of in terms of the amount of time that an average worker needed to labor in order to earn enough for the 100-watt bulb to glow for an hour.
In 1750 BC, the people of Babylon used sesame oil to light the lamps, and had to work for 400 hours to produce the said amount of light. In around 1800, using talcum candles, 50 hours of work was required. Using a gas lamp in the late 19th century, three hours were necessary. Using an energy-saving bulb today, you will have to work for the blink of an eye – a second. This amounts to a phenomenal advance in productivity and thus prosperity.
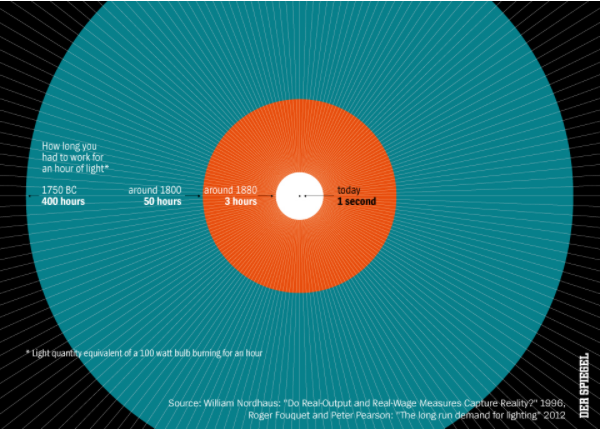
Source: DER SPIEGEL/Statista
Over recent decades, the combination of a larger pool of global labor, transformative technologies and the expansion of global value chains has led to a massive supply shock that has generated the ‘good’ disinflation which advances prosperity for the world’s population as a whole.
Nevertheless, the inflation-targeting orthodoxy that dominates central banking has ensured an inflation of the money supply in an attempt to thwart the supposed menace of falling prices, but in our view there are good reasons to believe that this policy framework has had its day.
Time to Retire the Phillips Curve?
The above structural changes are likely to have played a role in the weakening of the relationship between unemployment and inflation since the relatively short period of history incorporated into Phillips’ original model. The relationship now appears unstable at best, and often wholly elusive.
Combined with the fact that the process of creative destruction ensures that prices fall over the long term, the difficulties in finding a significant response from inflation to domestic unemployment should not be that surprising.
In other words, the Phillips curve looks rather flat to us.
[1] The Relation between Unemployment and the Rate of Change of Money Wage Rates in the United Kingdom, 1861-1957, A. W. Phillips, Economica, New Series, Vol. 25, No. 100 (Nov 1958), 283-299
[2] https://www.ft.com/content/d34ad3a6-5fd3-11e7-91a7-502f7ee26895
[3] Erroneously in my opinion
[4] Roger Fouquet and Peter J.G. Pearson: ‘Seven Centuries of Energy Services: The Price and Use of Light in the United Kingdom (1300-2000)’, The Energy Journal, Vol. 27, No. 1 (2006)
Authors

Brendan Mulhern
Global strategist, Real Return team
This is a financial promotion. Material in this publication is for general information only. The opinions expressed in this document are those of Newton and should not be construed as investment advice or recommendations for any purchase or sale of any specific security or commodity. Certain information contained herein is based on outside sources believed to be reliable, but its accuracy is not guaranteed. You should consult your advisor to determine whether any particular investment strategy is appropriate. This material is for institutional investors only. Any reference to a specific security, country or sector should not be construed as a recommendation to buy or sell this security, country or sector. Please note that strategy holdings and positioning are subject to change without notice.
Important information
This is a financial promotion. Issued by Newton Investment Management Limited, The Bank of New York Mellon Centre, 160 Queen Victoria Street, London, EC4V 4LA. Newton Investment Management Limited is authorized and regulated by the Financial Conduct Authority, 12 Endeavour Square, London, E20 1JN and is a subsidiary of The Bank of New York Mellon Corporation. 'Newton' and/or 'Newton Investment Management' brand refers to Newton Investment Management Limited. Newton is registered in England No. 01371973. VAT registration number GB: 577 7181 95. Newton is registered with the SEC as an investment adviser under the Investment Advisers Act of 1940. Newton's investment business is described in Form ADV, Part 1 and 2, which can be obtained from the SEC.gov website or obtained upon request. Material in this publication is for general information only. The opinions expressed in this document are those of Newton and should not be construed as investment advice or recommendations for any purchase or sale of any specific security or commodity. Certain information contained herein is based on outside sources believed to be reliable, but its accuracy is not guaranteed. You should consult your advisor to determine whether any particular investment strategy is appropriate. This material is for institutional investors only.
Personnel of certain of our BNY Mellon affiliates may act as: (i) registered representatives of BNY Mellon Securities Corporation (in its capacity as a registered broker-dealer) to offer securities, (ii) officers of the Bank of New York Mellon (a New York chartered bank) to offer bank-maintained collective investment funds, and (iii) Associated Persons of BNY Mellon Securities Corporation (in its capacity as a registered investment adviser) to offer separately managed accounts managed by BNY Mellon Investment Management firms, including Newton and (iv) representatives of Newton Americas, a Division of BNY Mellon Securities Corporation, U.S. Distributor of Newton Investment Management Limited.
Unless you are notified to the contrary, the products and services mentioned are not insured by the FDIC (or by any governmental entity) and are not guaranteed by or obligations of The Bank of New York or any of its affiliates. The Bank of New York assumes no responsibility for the accuracy or completeness of the above data and disclaims all expressed or implied warranties in connection therewith. © 2020 The Bank of New York Company, Inc. All rights reserved.