

The first two weeks since the inauguration of President Trump have provided little new information about the policy agenda of the new administration. The ‘new news’ has been the continuation of the inconsistency and belligerence of the Trump campaign, which many hoped had passed with Trump’s apparently conciliatory acceptance speech on 9 November. However, financial-market participants appear to continue to believe that the plans for tax reform and deregulation will be the dominant thrust of future US policy, and that the promise to ‘Make America Great Again’ will carry the hallmarks of the Reagan administration of the 1980s.
We share the optimism that freeing the US economy from poorly designed regulation and an overly burdensome tax system has the potential to reignite ‘animal spirits’ and raise productivity, employment and incomes – if it is approached in the right manner. We are less convinced that delivering a positive agenda for change can meet heightened market expectations of a rapid transformation of the economy. Although history takes a favourable view of the Reagan administration, redirecting the economy was not easy. Furthermore, the backdrop was very different in terms of demographics, the level of indebtedness in the economy, and the state of financial markets.
Below, we highlight some of the issues that are likely to impair the ability of the new president to swiftly deliver the rebirth of a more dynamic economy.
Change is never easy
Ronald Reagan was elected president at the start of November 1980, when the US economy was in the process of recovering from a recession that the National Bureau of Economic Research (NBER) dates as having run from January to June of that year. The chart below plots the Institute of Supply Management (ISM) manufacturing survey, which is widely used as an indicator of the pace of growth in industry; the election date is marked with a vertical line. The survey is constructed such that a reading of 50 is supposed to demark the separation between a growing and shrinking manufacturing sector. Historically, a reading below 43 has indicated a recession for the wider economy.
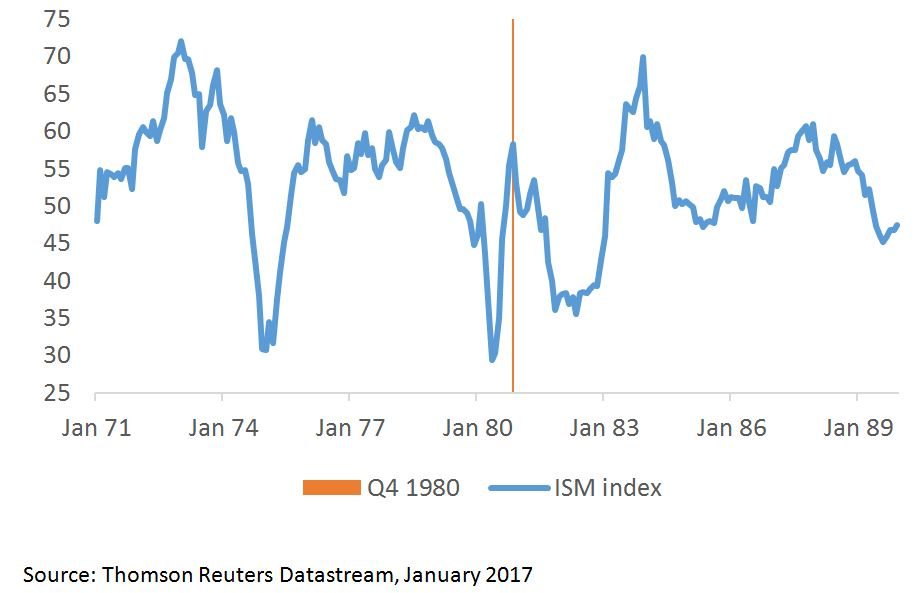
While there was plenty else going on at the start of the 1980s – not least the campaign by the Federal Reserve led by Paul Volcker to rid the US economy of the rampant consumer-price increases that had ravaged the 1970s – the ISM survey highlights both the sharpness of the 1980 downturn and how the election of President Reagan coincided with the peak of the rebound from the recession. Furthermore, the chart illustrates how the recovery was short-lived, with the new president’s ‘great reform’ agenda being met at its outset by the start of a second downturn (thereby creating a ‘double-dip’ recession).
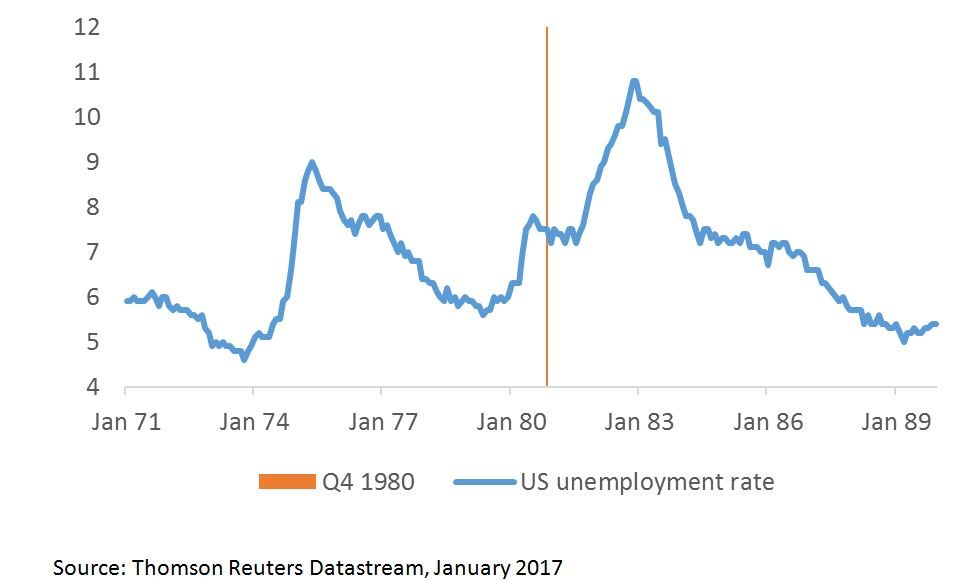
As a result of the 1980 recession, the level of unemployment had risen from a low of 5.7% in mid-1979 to 7.5% on election day. A year after the inauguration of President Reagan, the unemployment rate had risen to 8.3% and was on its way to a peak of 10.4% in early 1983.
The consequence of the policy changes in the early 1980s was a dramatic loss of pricing power. This is highlighted by the pricing index included within the ISM manufacturing survey.
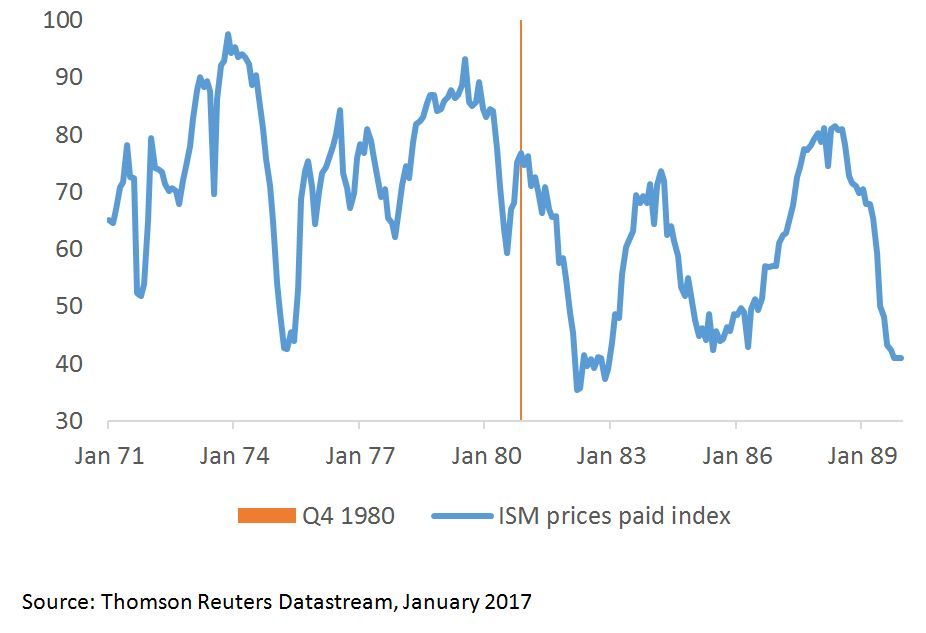
While this series typically held above 60 during the 1970s, indicating persistent and sharp price rises, it followed a generally lower trajectory in the 1980s after the 1982 downturn.
This raises a further issue that might trouble the incoming administration about pursuing a Reagan-like reform agenda. It is not clear that the constituencies that have elected Donald Trump benefited from the Reagan era. As the earlier chart of the unemployment rate demonstrates, even by the outset of the second Reagan term at the end of 1984, the unemployment rate had only just returned to the level that had been inherited at the time of his first election win.
The poor performance of the US manufacturing sectors in the early 1980s was such that efforts at lobbying Congress for protectionist laws succeeded in pushing the White House to champion the negotiations that became the Plaza Accord of September 1985. This agreement saw the US, France, Japan, UK and West Germany actively intervening to devalue the US dollar in order to boost US industrial activity.
As today, a challenge that confronted the Reagan era was the disruptive influence of technology, necessitating changes to working practices. In spite of success during the period in creating jobs for the economy as a whole (with total employment having risen from 99.5 million to 117.9 million), manufacturing employment of 17.9 million at the end of 1989 was below the 18.6 million level when President Reagan was first elected.[1] Deregulation that reduces intervention and allows capital to move to the companies and industries that are generating the strongest returns may not fit with supporting ‘traditional’ employment.
You don’t want to start from here
The challenge for any incoming government is that it does not start with a clean slate, as the UK’s coalition government realised in 2010 when the new chief secretary to the Treasury arrived in his office to find a note from his predecessor simply reading “there’s no money left”.[2]
President Trump does not face government finances that are in the same parlous state as those in the immediate aftermath of the credit crunch. However, much like the situation faced by President Reagan, he is inheriting an economy that has been distorted by a prolonged period during which interest rates have been below the rate of inflation.
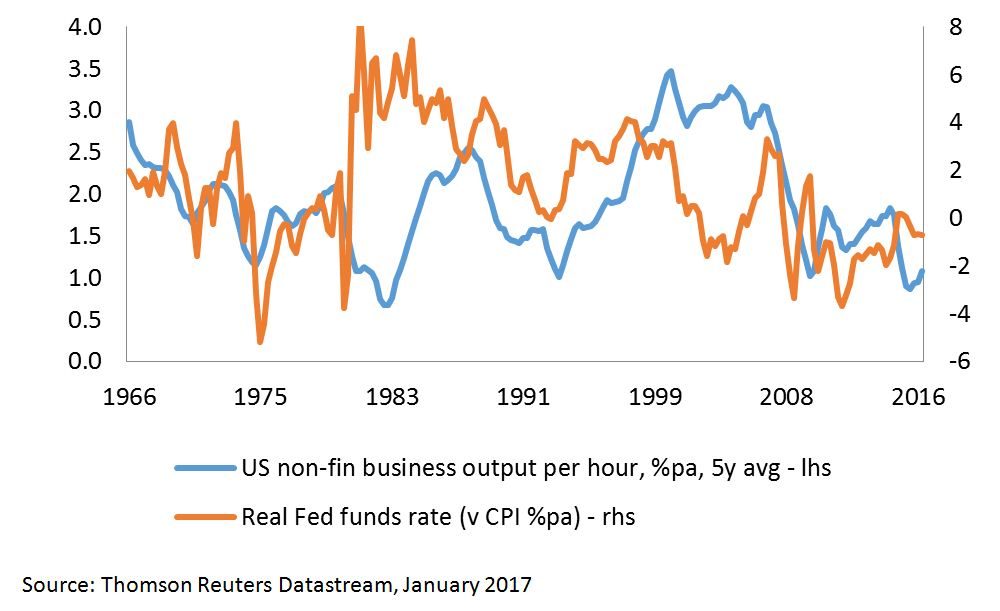
Is it simply coincidence that the longer the period of falling interest rates went on during the 1970s, the more productivity deteriorated, or that the same cheap money policy has existed alongside an ‘unexplained’ deterioration in output per worker since the credit crunch?
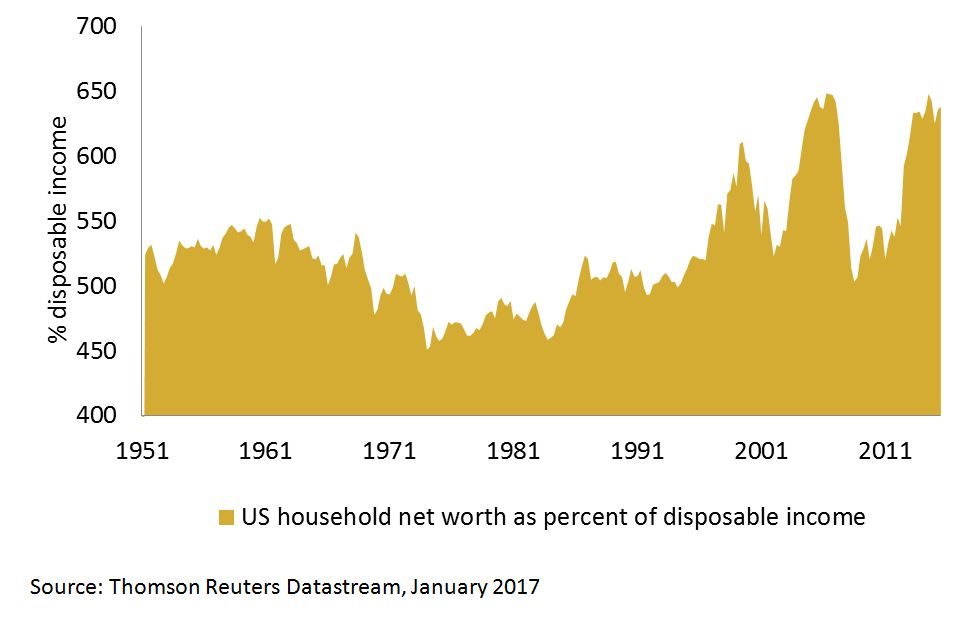
The added difficulty for President Trump is that, whereas the obvious manifestation of the inflationary monetary policies of the 1970s was in the unpopular and rapid increase in consumer prices, in the modern era it is asset prices that have been (deliberately) inflated. The chart below plots the percentage of US household net worth to disposable income, which is above 600% for only the third time since the middle of the twentieth century.
Changing course when you are heading in the wrong direction can be the correct choice. That doesn’t mean that doing so is easy, or that the payback fits neatly into the requirements of the electoral (let alone financial) cycle. Furthermore, the long-term gains that were achieved by President Reagan originated from a very different point in terms of the age of baby boomers, market valuation, interest rates and use of credit. History may look back kindly on the legacy of President Trump; however, even if this does prove to be the case, the journey is likely to be longer than many investors appear currently to believe.
[1] Source: Thomson Reuters Datastream, January 2017
[2] https://www.theguardian.com/politics/2010/may/17/liam-byrne-note-successor
Authors

Newton Real Return team
The team who manage the Newton Real Return strategy.
Any reference to a specific security, country or sector should not be construed as a recommendation to buy or sell investments in those countries or sectors.


Comments