

The rise of the middle-class consumer has been a well-followed structural growth story in emerging markets for some time. The growth in income in Asia – and particularly its growth over the last four decades – is starkly depicted in the Gapminder charts below. According to United Nations statistics, the world’s population stood at approximately 1 billion in 1800, and had reached 7.3 billion by 2015.[1] The vertical axes represent global population, while the horizontal axes represent average daily income levels in US dollars.
They reveal just how far Asia has come in terms of rising income levels over the last 200 years. Back in 1800, almost 86% of the global population lived below the extreme poverty line, earning less than the equivalent of USD 2 a day, with the bulk of that figure made up by Asia’s population. The percentage of the global population receiving less than USD 2 a day had dropped to around half of the world’s population by the mid-1970s, and to just over 11% by 2015. However, other than the huge growth in overall global population, the most eye-catching factor over the last 40 years is that while European income levels have remained fairly static, the income-earning power of Asia has come to dominate the global picture.
How Asia’s population came to dominate global income
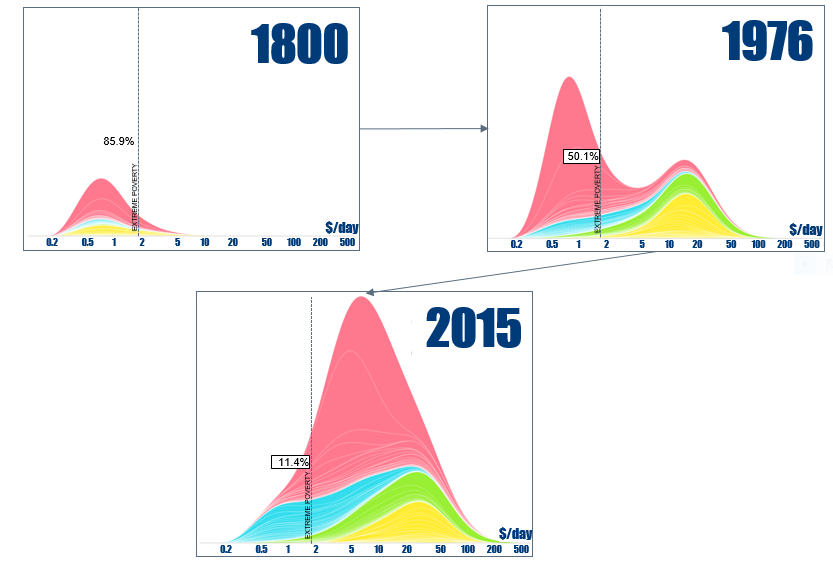
Pink = Asia, blue = Africa, green = North & South America, yellow = Europe
Source: Gapminder, 2017
China’s tourists flex their muscles
One way to see just how powerful a driver this shift in Asian earning potential can be is to drill down to look at its potential impact on individual sectors, not least on tourism.
As the primary driver of that shift in Asian income growth (along with India), the Chinese consumer is starting to flex its muscles to spend more of its growing disposable income on travel.
China is already the second-largest tourism market in the world, accounting for half of the growth in the global travel industry, but much of that tourism is domestic, and its citizens only make an average of 0.09 overseas trips per annum, compared to 0.3 and 1.2 in the US and UK respectively.
Given the relatively low overseas-trip frequency in China compared to many of its Western peers (see the charts below), the rise of global Chinese tourism is a structural growth story with huge long-term potential. Moreover, in 2016, just 6.3% of China’s 1.3 billion population had passports, but that number is expected to double within five years, with growth expected to stay well over 10% on an annualised basis.
Broker CLSA estimates that Chinese tourism will become a RMB 7.5 trillion (USD 1.1 trillion) market by 2020, with the sector expected to produce a compound annual growth rate (CAGR) of 13% over the next five years. Given the explosion in online travel booking in the country, it estimates that Chinese online travel booking will grow at an even faster rate –30% CAGR – over the same time frame.[2]
Trip frequency is still low in China…
…and Chinese passport ownership is projected to continue to grow strongly
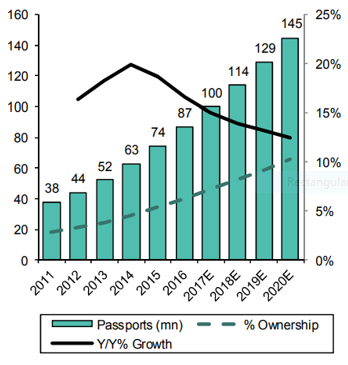
Source: China.org.cn, Ministry of External Affairs India, Bernstein analysis and estimates
Finally, the following chart shows the relatively strong correlation between GDP per capita and the percentage of a country’s population that uses air travel. Currently, China’s GDP per capita, at around USD 10,000 per annum, remains relatively low compared to many of its global peers, but there is plenty of scope for that to rise.
Domestic tourism in China remains the dominant force at present, with Macau and Hong Kong still the overriding favourite destinations and Hainan Island often almost full to bursting point. However, as its population grows wealthier and its huge airport infrastructure expansion programme continues, we expect the number of Chinese tourists flying abroad for their holidays to continue to grow strongly for many years.
Global relationship between air travel and GDP per capita, 2016
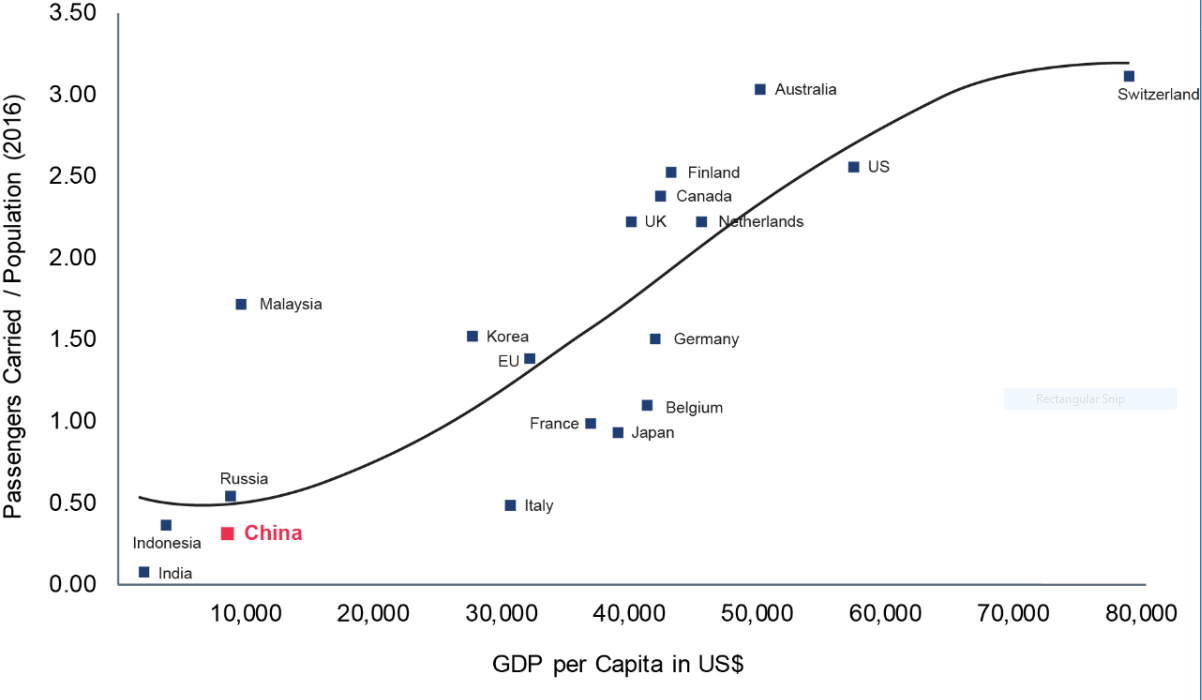
Source: World Bank, ICAO, Bernstein analysis
[1] http://www.un.org/en/development/desa/news/population/2015-report.html
[2] CLSA China online travel sector outlook, May 2016
Authors

Newton global research team
Our team of research analysts.
This is a financial promotion. Any reference to a specific country or sector should not be construed as a recommendation to buy or sell investments in those countries or sectors. Please note that holdings and positioning are subject to change without notice. Compared to more established economies, the value of investments in emerging markets may be subject to greater volatility, owing to differences in generally accepted accounting principles or from economic, political instability or less developed market practices.


Comments