

Many commentators in 2008 thought that in the aftermath of the global financial crisis government debt issuance would rise, and as a result yields would have to rise to accommodate the extra supply.
In fact, the opposite has proved true, and instead we have moved into a low-inflation world with correspondingly low cash rates.
As you can see from the chart below, the total return on a broad global government-bond index has been just under 41% over the last nine years.
Bank of America Merrill Lynch Global Government Bond Index total return – 10 years to 31 August 2017
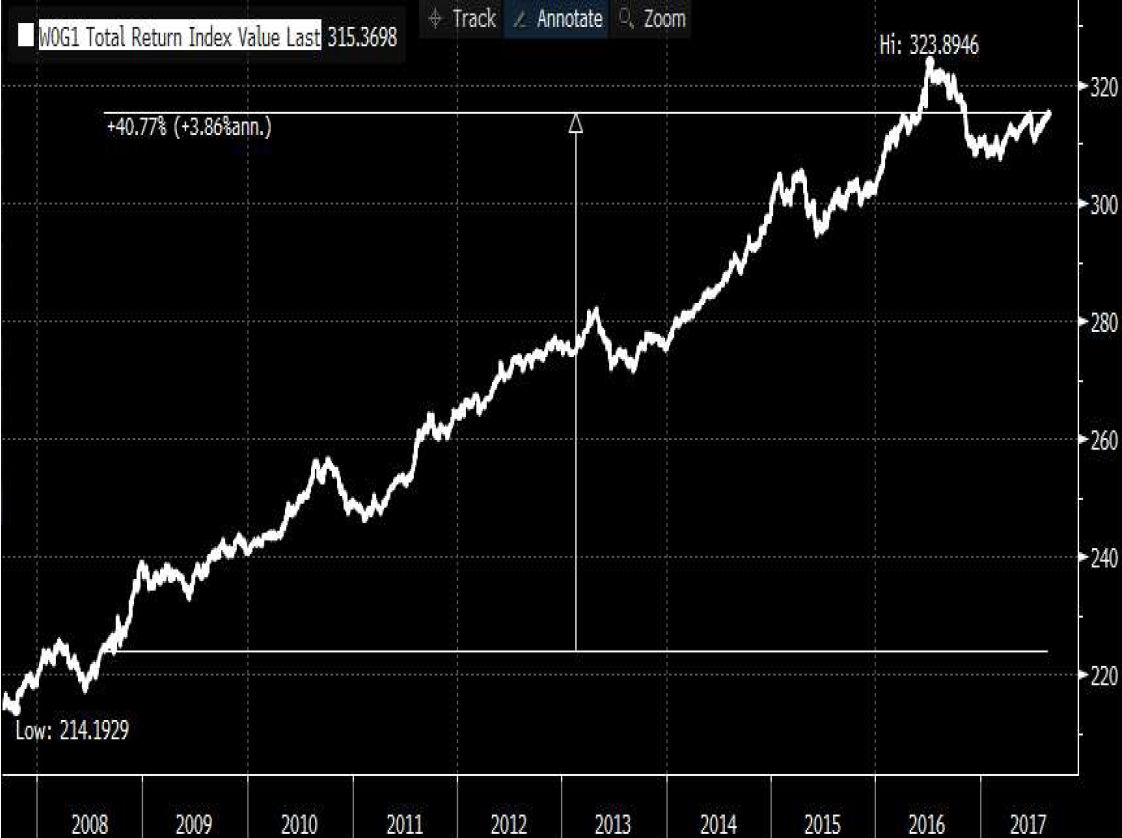
Source: Bloomberg, September 2017
Over the same time period, the face value of this index has doubled from US$12.25 trillion to US$24.5 trillion – a staggering US$113 billion each month.
So where has the demand come from? The central banks have been the most voracious buyers, purchasing on average US$100 billion a month.[1] Investors have also been moving up the curve as positive rates on cash have disappeared. Elsewhere, there is also a healthy growth in household savings (see below chart), some of which has found its way into the safe-haven bond markets. According to Deutsche Bank research, of the US$1.8 trillion saved each year by 27 OECD (Organisation for Economic Cooperation and Development) member countries, approximately US$150 billion needs to be invested in stocks and bonds every month.
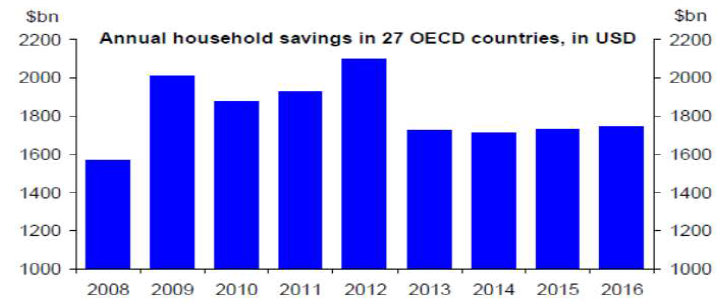
Source: OECD, Deutsche Bank Global Markets Research.
Note: Countries are Australia, Austria, Belgium, Canada, Czech Republic, Denmark, Estonia, Finland, Germany, Hungary, Ireland, Italy, Japan, South Korea, Luxembourg, New Zealand, Netherlands, Norway, Poland, Slovakia, Spain, Sweden, Switzerland, US, France, Portugal & UK.
At present, governments are starting to lean away from fiscal austerity, and central banks are starting to slow their buying of bonds, and in the case of the US Federal Reserve reversing the process altogether.
However, while central banks and governments are changing tack, one thing that hasn’t changed is the low-growth, low-inflation environment. The four Ds – debt, demographics, disruption and distortion – could help explain this influence…
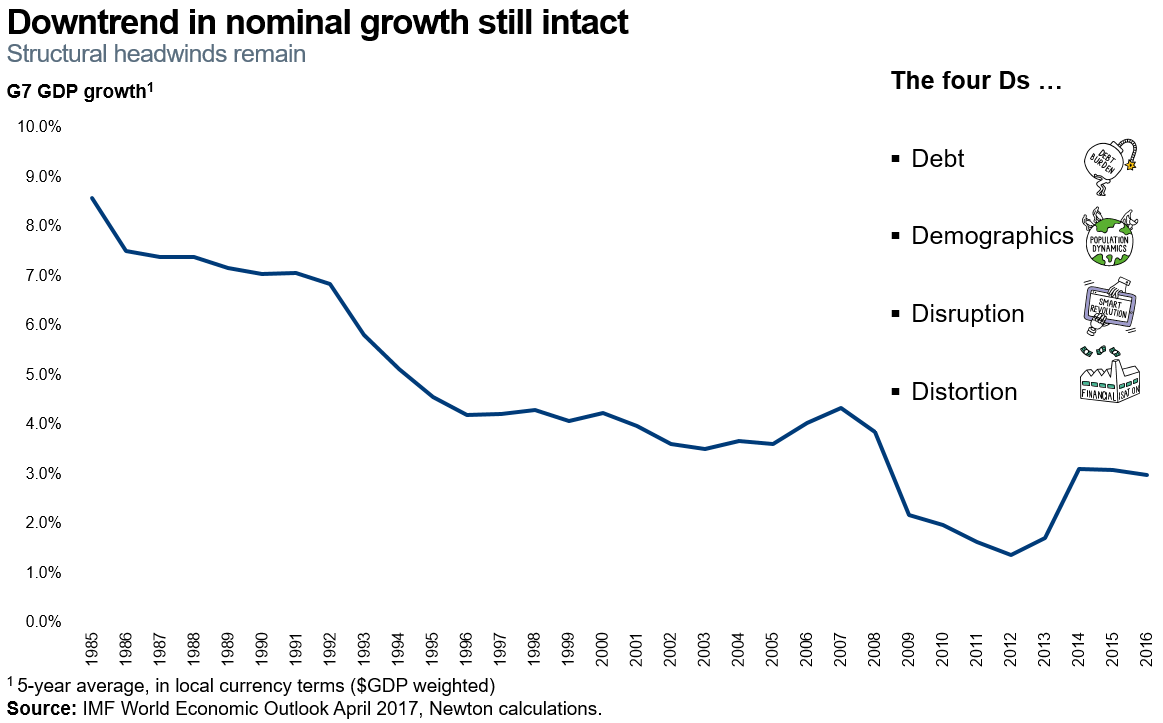
Whether it’s the disruptive force of Amazon changing the way goods are bought and sold, or the baby boomers leaving the workforce and destroying the relationship between low unemployment and inflation, one thing is clear in our mind: bond yields can’t rise too far before these high debt levels become difficult to service and growth starts to suffer once more.
While we do not believe this would stop yields rising from current levels, we do believe it provides a cap that may not be too far away.
[1] Source: Newton, 2017
Authors

Paul Brain
Investment leader, fixed income
Any reference to a specific security, country or sector should not be construed as a recommendation to buy or sell investments in those countries or sectors. Please note that holdings and positioning are subject to change without notice.


Comments