

Zero interest rate policy (ZIRP), quantitative easing (QE), and latterly negative interest rate policy (NIRP) have failed to turn lacklustre economic recoveries into inflation-creating beasts.
In Japan, where this problem has been around since the early 1990s, authorities are trying yet another idea – yield curve manipulation (YCM). At a time when the US Federal Reserve (Fed) has delayed a rate rise until at least December, Japan’s move is certainly no bazooka. But it is an interesting approach nonetheless.
Step back in time
The Bank of Japan’s targeting of long-term rates as well as short rates reminds us of the period in the 1940s and 1950s when the US fixed 10-year government borrowing rates. It opens the door for more government spending financed at very low rates without further undermining the banking system.
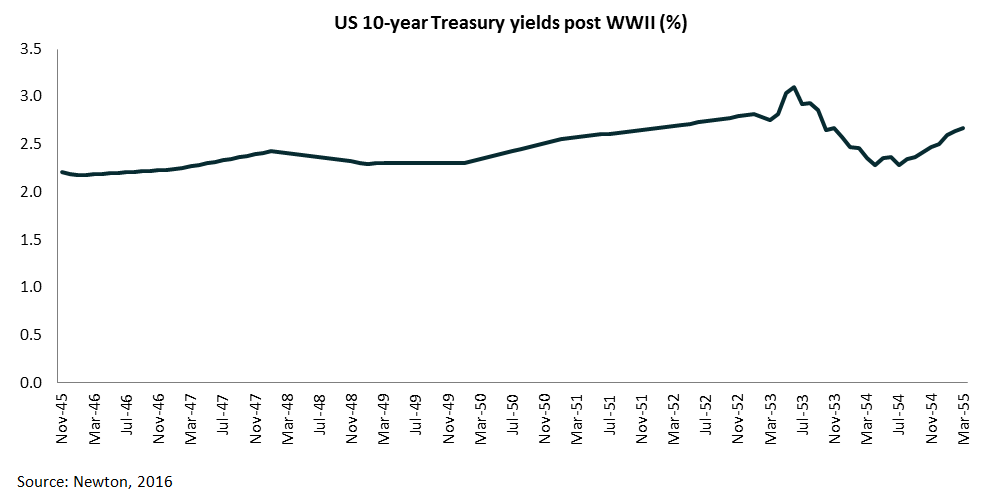
During this period, John Maynard Keynes argued for the ‘reverse tap’, which was essentially quantitative easing but with a difference – targeting long-term rates. A reverse tap involves a central bank setting the price of any particular government bond and standing ready to buy any quantity needed to ensure an implicit yield is met. From the graph above, which tracks the US 10-year Treasury yield, you can see how effective the US authorities were from 1945 to 1955.
At the same time, there was a significant increase in government spending at low rates (through programmes like the Marshall Plan) to help economies recover. The recovery that followed caused a rise in volatility towards the end of the decade, and a significant inflation problem thereafter.
It is possible to suggest that the move to fixing yield curves today could be a precursor to increased government spending, which could eventually bring about the end of the bond market rally.
Bull run almost over?
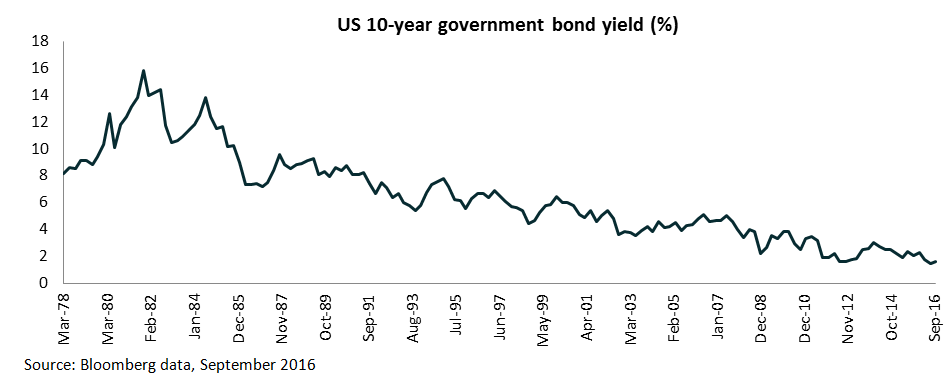
The 35-year bull market in bonds started on 30 September 1981 (see chart below), with the US 10-year Treasury bond yield peaking at 15.8% on that day. The aggressive tightening of monetary policy by Fed chairman Paul Volcker from 1979 through to May 1981 led to the recession of 1981/82, and a decline in inflation (and bond yields) which continued for the next 35 years.
Along the way, the bond market has had periodic bear phases, which look small in comparison, but were been painful at the time. The most recent (a ‘term tantrum’) occurred in the second quarter of 2015, when the euro markets got too carried away with European Central Bank action and sold off (bund yields rose from 0.07% to 0.97% in two months). Prior to that, the Fed ‘Taper Tantrum’ of 2013 was slightly worse in terms of yield changes for US 10-year Treasuries (+1.26% over five months).
To call the end of the 35-year bull market would require a belief that the long-term disinflation trend has come to an end. The surplus of goods and services, ageing populations, and the hangover of the credit crisis (as identified by our themes ‘abundance, ‘population dynamics’, ‘state intervention’ and ‘debt burden’) suggest calling time on the trend may require something more significant. For now, another tantrum may have started.
Authors

Paul Brain
Investment leader, fixed income


Comments